An Incremental Cost-Benefit Analysis of Worldwide Patent Coverage
- Group A - all counries, average RVS=1.6 (99% market coverage, $283,000 filing cost)
- Group B - all countries with an RVS=10 or greater, RVS=138 (95%, $96,000)
- Group C - PCT member countries with an RVS=10 or greater, RVS=161 (93%, $81,000)
- Group D - All countries with an RVS of 20 or greater, RVS=206 (91%, $62,000)
These numbers, along with his estimated PCT national stage filing cost data, result in the following chart showing Percent Market Coverage and PCT National Stage Cost for each Group:
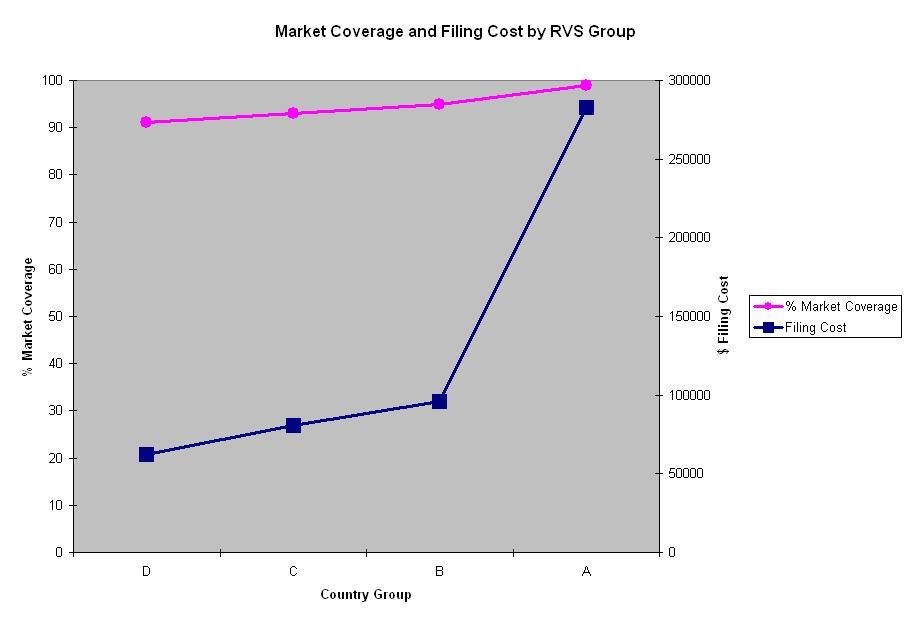
Mr. Silverman draws two conclusions from this chart. First, selecting option B over option D, increases filing costs about 35% in order to gain exclusivity in only about an extra 4% of the world market. Second, the cost of exclusity increases dramatically for anything over about 95% of the world market.
He goes on to explain why reducing translation cost (such as by reducing the number of pages in the speciification) is not likely to matter when the RVS for a particular country is well below a minimum RVS, such as 138 for Group B. However, when the analysis is focussed on just European Patent Convention members, the high translation costs for Sweden, Denmark, Hungary, and Finland, mean that "omission of these four countries might make sense in a European-lite strategy."
Furthermore, since most of the revenue attributable to a European pharmaceutical patent is produced during the period of the so-called "Supplementary Protection Certificate," patents in Denmark, Finland, Slovakia, Latvia, and Estonia can have a negative net present value. However, the NPV calculation can be highly sensitive to certain variables, especially in countries where the NPV is only slightly negative.
Nonetheless, there are still big differences in the patent strategies of pharmaceutical companies. Some companies routinely file patent applications in fifty to seventy countries while others file in over ninety countries.

0 Comments:
Post a Comment
<< Home
© 2004-2007 William F. Heinze